Financial Insecurity in the Nonprofit Workforce
Landmark research finds that over 1 in 5 nonprofit employees in the United States struggle financially.
22% of Nonprofit Workers Struggle Financially
Nonprofits are fundamental to American society, delivering vital services and resources to those in need. Yet, a joint Independent Sector and United For ALICE study examining financial insecurity in the nonprofit workforce found that 22% of nonprofit employees experienced financial hardship in 2023.
Independent Sector and United For ALICE’s first-ever ALICE in the Nonprofit Workforce: A Study of Financial Hardship report finds that more than 1 in 5 nonprofit employees in the United States struggled financially. The report rigorously analyzes publicly available data to understand the financial status of the country’s 14 million nonprofit employees in greater detail than ever before.
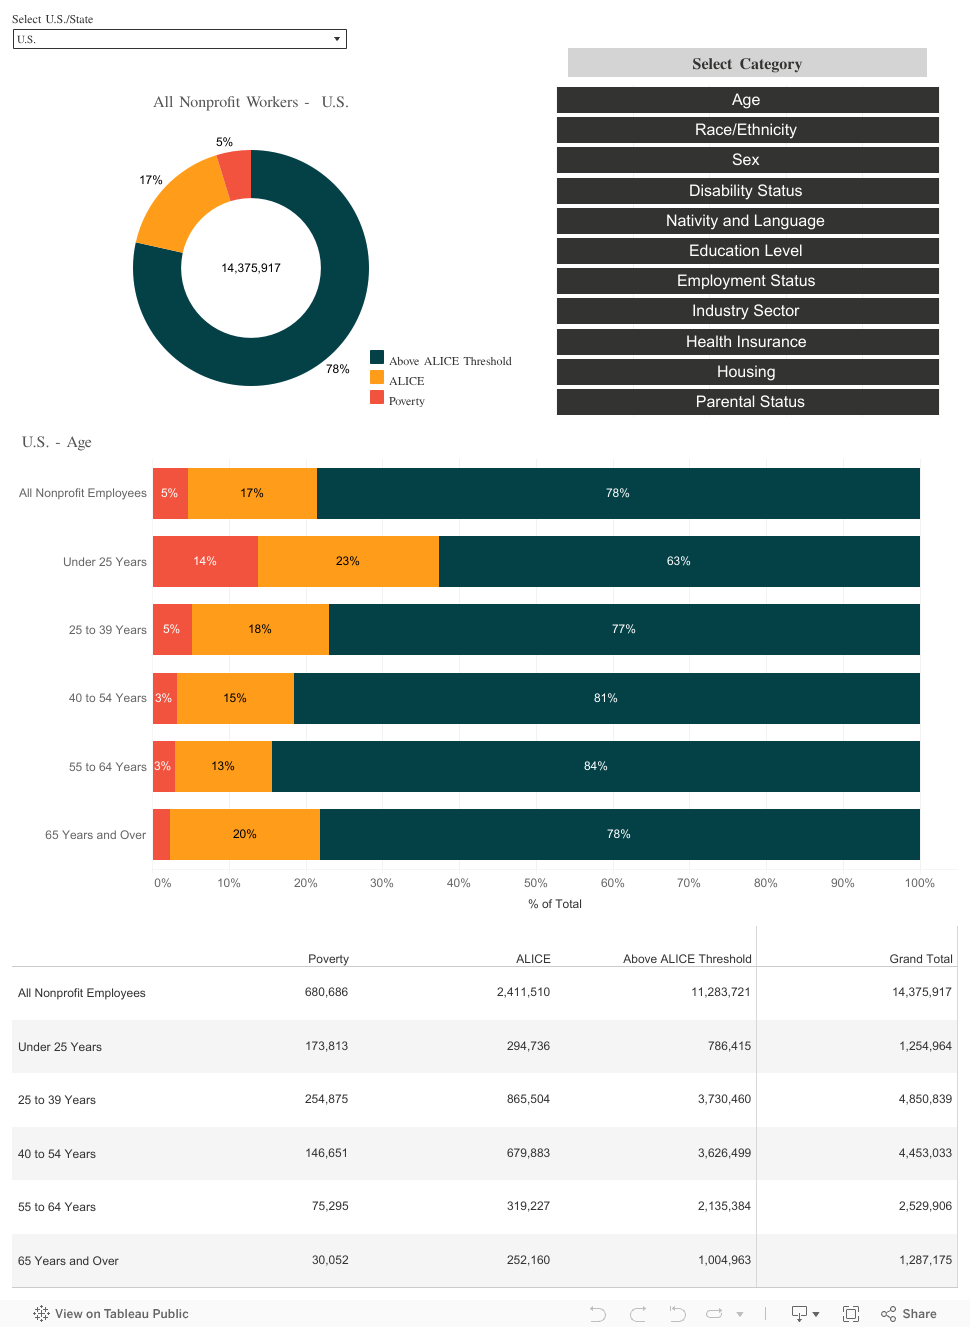
Of all nonprofit workers, 5% were below the official U.S. poverty level, and another 17% — more than three times as many — were ALICE®, or Asset Limited, Income Constrained, Employed. ALICE nonprofit employees live in households that earn more than the Federal Poverty Level, but less than what it costs to survive in the counties where they live. They can’t afford the basics: housing, child care, food, transportation, health care, technology, and taxes.
ALICE in the Nonprofit Workforce
Read a first-of-its-kind study on financial hardship in the sector.
Benefits of Closing the ALICE Gap
See the effects of investing in nonprofit workers who are struggling financially.
The ALICE Nonprofit Workforce Dashboard
The ALICE Nonprofit Workforce Dashboard includes thousands of points that shed new light on nonprofit workers and their household financial status. The Dashboard provides state-level data on nonprofit workers’ financial status for the first time. This innovative research focuses on the ALICE® (Asset Limited, Income Constrained, Employed) measures. ALICE households earn above the Federal Poverty Level (FPL), but not enough to afford basics in the communities where they live.
The Dashboard shows the number and percentage of nonprofit workers in 2023 by household income status, including those with:
- Income below the Federal Poverty Level (Poverty)
- Income above the Federal Poverty Level but below what is needed to afford the cost of basic expenses (ALICE). Tailored by nonprofit workers’ household composition and location.
- Income above the cost of basics (Above ALICE Threshold)
Workers below the ALICE Threshold include households in poverty and ALICE households combined.
The Dashboard contains two tools: Hardship by Category and Intersectional Hardship.
Tool 1 – Hardship by Category
Explore the data on nonprofit workers in financial hardship by a single category, such as age, race/ethnicity, nativity and language, disability status, living arrangements, and other parameters.
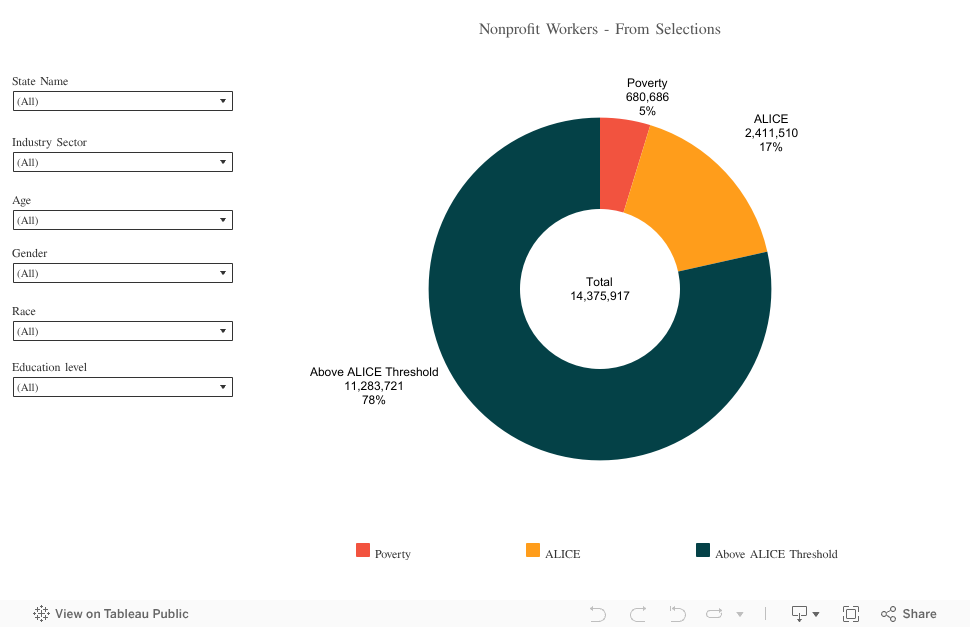
Tool 2 – Intersectional Hardship
Combine intersecting categories that affect hardship (such as nonprofit workers who are Hispanic, have a bachelor’s degree, and work in the Social Assistance sector). Select one or more options in the drop-downs to combine groups.
Technical Details and FAQ
For Tool 1, select a state or “U.S.” to see national data, then select a category (like Age, Race/Ethnicity, or Disability Status). Hover over the bar graph to see the number and percentage of nonprofit workers in each group and view the table below the bars to see the number of nonprofit workers in each group.
For Tool 2, select a state or “U.S.” to see national data, then use the drop-down menus to select variables across different categories (for instance, “Bachelor’s Degree or Higher,” “Hispanic,” and employed at a “Social Assistance” nonprofit organization). Select one or more options in the drop-downs to combine groups. The pie chart will change based on your selections to show the percentage and number of nonprofit workers in that category who are in poverty-level, ALICE, or Above ALICE Threshold households. Note that some small groups may fail to display especially in smaller states (see below).
The primary source of these analyses is the American Community Survey, administered by the U.S. Census Bureau. For full information on the underlying data sources and how they’re used, please see here for more on the ALICE methodology.
Not at present, but if you have suggestions for ways we can improve the accessibility or clarity of these resources please reach out to us at research@independentsector.org.
The PDF report, which was released in 2024, is based on 2022 data. The dashboard tools on this page, published in 2025, are based on 2023 data. There is a lag in when data are available from the Census Bureau and other agencies. In both 2022 and 2023, a total of 22% of nonprofit workers were below the ALICE threshold.
If there is a discrepancy between identical numbers in the report and the dashboard, we suggest using the dashboard data, though the report explains some of the data and issues in more depth than this page does.
The American Community Survey, which United for ALICE uses for its analyses, samples 3.5 million American households annually, making it one of the largest U.S. Census Bureau data sources. However, not everyone responds to the survey, and data for small groups is limited (e.g., people of a specific race working in a certain industry in the nonprofit sector).
When there are too few data points to provide a good representation of a group, the best practice in research is not to provide the information to avoid providing misleading or unrepresentative data. So, our tools on this page do not always display statistics for every demographic or group for which there is limited data.
The research shows that certain industries within the nonprofit sector have a higher proportion of workers who struggle to make ends meet, including social assistance, arts, recreation, and religious organizations. This may reflect variation in funding and staffing models across the sector. We also know that younger workers, workers with less formal education, and part-time workers are more likely to fall below the ALICE threshold, reflecting lower pay. Single parents are much more likely to struggle financially because they have greater costs than households without children without the income of an additional worker in the household.
Our research also shows that Black, Hispanic, and American Indian and Alaska Native workers are more likely to be struggling financially, as are people with disabilities. Racial and ethnic disparities in ALICE status reflect broad, deep disparities driven by historic and contemporary social and economic issues, and disparities in income are related to wealth disparities in communities.
Independent Sector produces recurring and standalone research and analysis on topics related to the health of the nonprofit sector and philanthropy.
We typically release the Value of Volunteer Time in the spring; in the summer, we release Trust in Nonprofits and Philanthropy, which examines public trust in the charitable sector; and in the fall/winter we release Health of the U.S. Nonprofit Sector, which examines sector health across four dimensions: economy and finance, workforce, trust and governance, and public policy and advocacy. We also annually cohost the Symposium on Public Policy for Nonprofits with ARNOVA and Nonprofit Policy Forum.
Independent Sector’s other recent projects include the creation of nonprofit state profiles, a program of nonprofit advocacy and civic engagement research, public opinion polling on policy issues impacting the sector, and unique research projects produced as part of Independent Sector’s Visiting Scholar Program.